Logical Venn Diagram
- Some of the Cricket players are Tennis players, Some Tennis players are Hockey players, no Cricket player is a Hockey player. Which one of the following diagrams represents the above statements?
-
View Hint View Answer Discuss in Forum
According to above all given informations in question , we can say that
Diagram ( B ) represents the best relationship between Cricket players , Tennis players and Hockey players .Correct Option: B
According to above all given informations in question , we can say that
Diagram ( B ) represents the best relationship between Cricket players , Tennis players and Hockey players .As shown in given venn - diagram .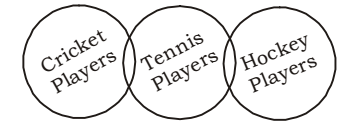
- If each circle represents a class of objects/ideas, written below then find out the answer figure which illustrates better the relationship among them: Cats, Rats, Animals
-
View Hint View Answer Discuss in Forum
According to above given question , we know that
Cats are different from rats.
But both are animals.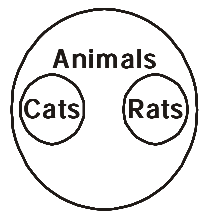
Correct Option: D
According to above given question , we know that
Cats are different from rats.
But both are animals.
From above it is clear that option ( D ) represents the best relationship between Cats, Rats and Animals . As shown in given venn - diagram .
- Which of the following diagrams represents the relationship of Profit, Dividend, Bonus?
-
View Hint View Answer Discuss in Forum
From above given question , we can say that
Bonus and Dividend are different from each other but both these are parts of profit.Correct Option: B
From above given question , we can say that
Bonus and Dividend are different from each other but both these are parts of profit.
From above it is clear that option ( B ) represents the best relationship between Profit, Dividend and Bonus . As shown in given venn - diagram .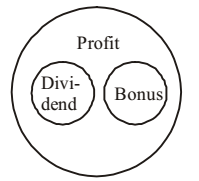
- Which one of the following diagrams represents the relationship among Delhi, Lucknow, Uttar Pradesh?
-
View Hint View Answer Discuss in Forum
As we know that
Delhi is separate state while Lucknow is part of Uttar Pradesh.Correct Option: C
As we know that
Delhi is separate state while Lucknow is part of Uttar Pradesh.
From above it is clear that Lucknow and Uttar Pradesh belong to same class and Delhi belongs to other class.
Hence , required answer will be option ( C ) .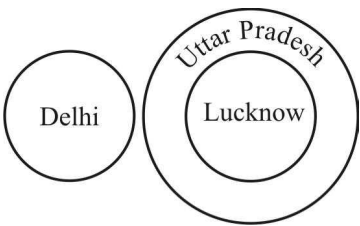
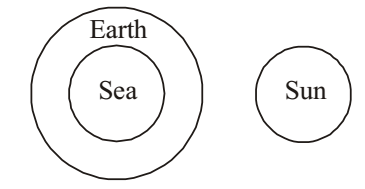
- Which one of the following diagrams best depicts the relationship among Earth, Sea, Sun ?
-
View Hint View Answer Discuss in Forum
As per the given above question ,we can see that
Sea is a part of Earth . Sun is the star .Correct Option: C
As per the given above question ,we can see that
Sea is a part of Earth . Sun is the star .
From above it is clear that Earth and Sea belong to same class but Sun belongs to different class .
Hence , required answer is option ( C ) .