Line chart
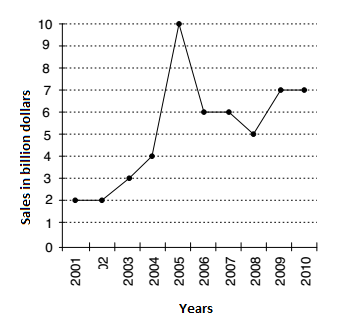
Direction: The following line diagram represents the yearly sales figures of a company in the years 2001–2010.
Examine the diagram and answer the following questions.
- The ratio of sales in 2002 to that in 2007 is :
-
View Hint View Answer Discuss in Forum
As per given graph, we can see that,
Sales in 2002 = 2 billion dollar
Sales in 2007 = 6 billion dollar
∴ Required ratio = Sales in 2002 : Sales in 2007Correct Option: B
As per given graph, we can see that,
Sales in 2002 = 2 billion dollar
Sales in 2007 = 6 billion dollar
∴ Required ratio = sales in 2002 : sales in 2007
Required ratio = 2 : 6 = 1 : 3
- The percentage increase in sales in the year 2005 with respect to the previous year is :
-
View Hint View Answer Discuss in Forum
As per given line graph, we can see that the
Sales in the year 2005 = 10 billion $
Sales in the year 2004 = 4 billion $∴ Percentage increase = Difference between both sales in 2005 and 2004 x 100 total sales in 2004
Correct Option: D
As per given line graph, we can see that the
Sales in the year 2005 = 10 billion $
Sales in the year 2004 = 4 billion $∴ Percentage increase = Difference between both sales in 2005 and 2004 x 100 total sales in 2004 Required percentage increase = 10 - 4 x 100 = 150 % 4
Direction: Study the following graph carefully and answer the questions given below it:

- If P is the percentage increase in tourist hotels from 2005 to 2006 and Q is the percentage increase in the tourist hotels from 2006 to 2008. Which of the following statements is true with respect to the relationship between P and Q?
-
View Hint View Answer Discuss in Forum
P = Number of hotels in 2005 to 2006 = (number of hotels in 2006 - number of hotels in 2005 ) x 100/ number of hotels in 2005
Q = Number of hotels in 2006 to 2008 = (number of hotels in 2008 - number of hotels in 2006 ) x 100/ number of hotels in 2006Correct Option: C
P = Number of hotels in 2005 to 2006 = (number of hotels in 2006 - number of hotels in 2005 ) x 100/ number of hotels in 2005
Here, P = (740 - 570) x 100/570 = 29.8%
Q = Number of hotels in 2006 to 2008 = (number of hotels in 2008 - number of hotels in 2006 ) x 100/ number of hotels in 2006
and also, Q = (838 - 740) x 100/740 = 13.2%
Hence, P > Q
- If percentage increase in number of hotels from 2007 to 2008 continued till 2009, how many new hotels would have come up in 2009?
-
View Hint View Answer Discuss in Forum
Number of hotels in 2007 to 2008 = (number of hotels in 2008 - number of hotels in 2007 ) x 100/ number of hotels in 2007
Correct Option: D
Number of hotels in 2007 to 2008 = (number of hotels in 2008 - number of hotels in 2007 ) x 100/ number of hotels in 2007
Percentage increase in number of hotels from 2007 to 2088 = (838 - 710)x 100/710 = 128 x 100/710 = 18% approx.
Since, required number of new hotels in 2009 = 838 x 18/100 = 150 approx.
- If in 2005 new hotels constructed were fewer by 10, what would have been the ratio between the new hotels constructed in 2004 and that constructed in 2005?
-
View Hint View Answer Discuss in Forum
See the graph and calculate the number of hotels.
Correct Option: A
Required ratio = (440 - 410) : (570 - 10 - 440) = 30 : 120 = 1 : 4

