Line chart
Direction: Study the following graph carefully and answer the questions given below it:

- What is the approximate percentage increase in to tourist hotels in 2008 over that in 2003?
-
View Hint View Answer Discuss in Forum
Increase in number of hotels = (number of hotels in 2008 - number of hotels in 2003 ).
Required percentage of increase = (number of hotels in 2008 - number of hotels in 2003 ) x 100 / number of hotels in 2003Correct Option: B
Increase in number of hotels = (number of hotels in 2008 - number of hotels in 2003 ).
Required percentage of increase = (number of hotels in 2008 - number of hotels in 2003 ) x 100 / number of hotels in 2003
Required percentage of increase = (838 - 410) x 100 /410 = 428 x 100 /410 = 100.4%
Approximate 100%
- During which of the given years increase in number of hotels over the previous year was highest?
-
View Hint View Answer Discuss in Forum
Increase in number of hotels over previous years = (number of hotels in previous year - number of hotels in current year).
Correct Option: C
Increase in number of hotels over previous years = (number of hotels in previous year - number of hotels in current year).
Increase in number of hotels over previous years are as follows:
In 2004, 440 - 410 = 30
In 2005, 570 - 440 = 130
In 2006, 740 - 570 = 170
In 2008, 838 - 710 = 128
Hence, in 2006, increase in number of hotels over 2005 was highest.
Direction: Study the following Graph carefully and answer the questions given below:
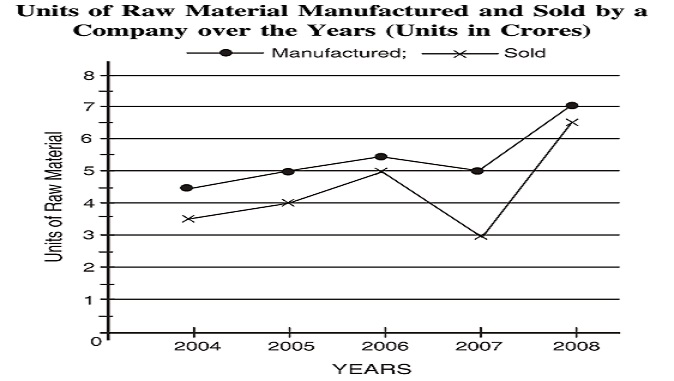
- What is respective ratio of the difference between the number of units manufactured and sold in the year 2006 to the difference between the number of units manufactured and sold in the year 2007?
-
View Hint View Answer Discuss in Forum
Required ratio = (number of units manufactured in the year 2006 - number of units sold in the year 2006)/ (number of units manufactured in the year 2007 - number of units sold in the year 2007)
Correct Option: B
Required ratio = (number of units manufactured in the year 2006 - number of units sold in the year 2006)/ (number of units manufactured in the year 2007 - number of units sold in the year 2007)
Required ratio = (5.5 - 5) / (5 - 3) = 0.5 / 2 = 1 / 4 = 1 : 4
- What is the approximate percent increase in the number of units sold in the year 2008 from the previous year?
-
View Hint View Answer Discuss in Forum
Required percentage of increase = (number of units sold in the year 2008 - number of units sold in the year 2007) x 100 / number of units sold in the year 2007
Correct Option: D
Required percentage of increase = (number of units sold in the year 2008 - number of units sold in the year 2007) x 100 / number of units sold in the year 2007
Required percentage of increase = (6.5 - 3) x 100/3 = 3.5 x 100/3 = 117%
- What is the average number of units sold over the years?
-
View Hint View Answer Discuss in Forum
Average number of units sold = ( Units sold in 2004 + Units sold in 2005 + Units sold in 2006 + Units sold in 2007 + Units sold in 2008 ) / 5
Correct Option: B
Average number of units sold = ( Units sold in 2004 + Units sold in 2005 + Units sold in 2006 + Units sold in 2007 + Units sold in 2008 ) / 5
Average number of units sold = (3.5 + 4 + 5 + 3 + 6.5)/5 = 22/5 = 4.4 crores

