Line chart
Direction: Study the following graph to answer the given questions.
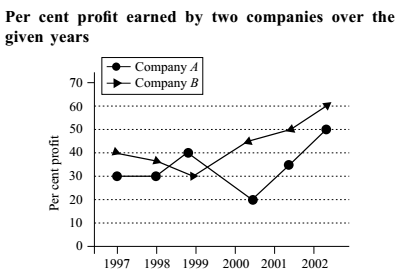
- If the income of Company A in 2002 was $ 600 billion, what was its expenditure?
-
View Hint View Answer Discuss in Forum
Given in question :- Income of Company A in 2002 = $ 600 billion
As per given line graph Profit = 60%Expenditure of Company A in 2002 = Income of Company A in 2002 x 100 100 + % profit
Correct Option: C
Given in question :- Income of Company A in 2002 = $ 600 billion
As per given line graph Profit = 60%
Use the below formula to calculate the Expenditure.Expenditure of Company A in 2002 = Income of Company A in 2002 x 100 100 + % profit Expenditure of Company A in 2002 = 600 x 100 = $ 375 billion 160
- If the income of the two companies in 1998 were equal, what was the ratio of their expenditures?
-
View Hint View Answer Discuss in Forum
Expenditure of Company A in 1998 ( E1 ) = Income of Company A in 1998 x 100 100 + % profit Expenditure of Company B in 1998 ( E2 ) = Income of Company B in 1998 x 100 100 + % profit
Ratio of their expenditures = E1 : E2Correct Option: B
Let the income of the two companies in 1998 be P.
Expenditure of Company A in 1998 ( E1 ) = P × 100 100 + 35 Expenditure of Company B in 1998 ( E2 ) = P × 100 100 + 30 Ratio of their expenditures = E1 : E2 = 100 x 130 = 26 : 27 . 135 100
Direction: The following line diagram represents the yearly sales figures of a company in the years 2001–2010.
Examine the diagram and answer the following questions.
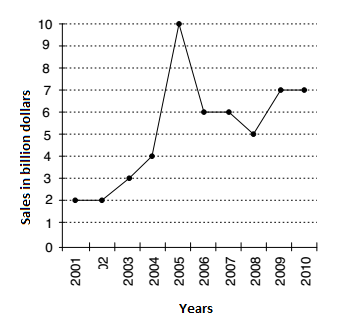
- Total sales (in billion of) from 2005 to 2008 is :
-
View Hint View Answer Discuss in Forum
As per given line graph, we can see that the
Sales in the year 2005 = 10 billion $
Sales in the year 2006 = 6 billion $
Sales in the year 2007 = 6 billion $
Sales in the year 2008 = 5 billion $
∴ Required total sales = Sum of all sales from 2005 to 2008Correct Option: B
As per given line graph, we can see that the
Sales in the year 2005 = 10 billion $
Sales in the year 2006 = 6 billion $
Sales in the year 2007 = 6 billion $
Sales in the year 2008 = 5 billion $
∴ Required total sales = Sum of all sales from 2005 to 2008
Required total sales = $ (10 + 6 + 6 + 5) billion= $ 27 billion
Direction: Study the following Graph carefully and answer the questions given below:
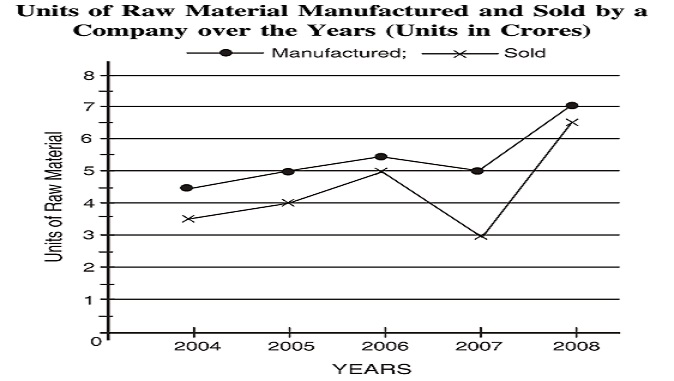
- What is the difference between the number of units manufactured and the number of units sold over the years?
-
View Hint View Answer Discuss in Forum
Total number of units manufactured = Units manufactured in 2004 + Units manufactured in 2005 + Units manufactured in 2006 + Units manufactured in 2007 + Units manufactured in 2008
Total number of units sold = Units sold in 2004 + Units sold in 2005 + Units sold in 2006 + Units sold in 2007 + Units sold in 2008
Correct Option: C
Total number of units manufactured = Units manufactured in 2004 + Units manufactured in 2005 + Units manufactured in 2006 + Units manufactured in 2007 + Units manufactured in 2008
Total number of units manufactured = 4.5 + 5 + 5.5 + 5 + 7 = 27 crores
Total number of units sold = Units sold in 2004 + Units sold in 2005 + Units sold in 2006 + Units sold in 2007 + Units sold in 2008
Total number of units sold = 3.5 + 4 + 5 + 3 + 6.5 = 22 crores
Hence, their difference = 27 crores - 22 crores = 5 crores
Direction: The following line diagram represents the yearly sales figures of a company in the years 2001–2010.
Examine the diagram and answer the following questions.
- By what percent did the sales in 2008 decrease in comparison to the sales in 2006?
-
View Hint View Answer Discuss in Forum
As per given line graph we can,
Sales in 2008 = 5 billion dollar
Sales in 2006 = 6 billion dollarPercentage decrease = Difference between sales in 2008 and 2006 x 100 total sales in 2006
Correct Option: C
As per given line graph we can,
Sales in 2008 = 5 billion dollar
Sales in 2006 = 6 billion dollarPercentage decrease = Difference between sales in 2008 and 2006 x 100 total sales in 2006 Percentage decrease = 6 - 5 x 100 6 Percentage decrease = 1 x 100 6 = 50 = 16 2 3 3

