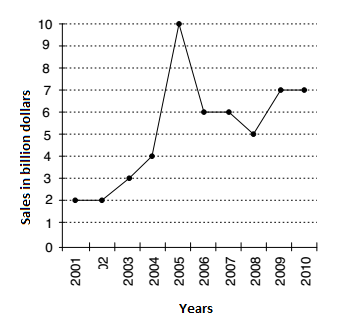
Direction: The following line diagram represents the yearly sales figures of a company in the years 2001–2010.
Examine the diagram and answer the following questions.
-
By what percent did the sales in 2008 decrease in comparison to the sales in 2006?
-
- 20 %
- 18 %
-
16 2 % 3
-
15 2 % 3
Correct Option: C
As per given line graph we can,
Sales in 2008 = 5 billion dollar
Sales in 2006 = 6 billion dollar
| Percentage decrease = | Difference between sales in 2008 and 2006 | x 100 |
| total sales in 2006 | ||
| Percentage decrease = | 6 - 5 | x 100 |
| 6 | ||
| Percentage decrease = | 1 | x 100 |
| 6 | ||
| = | 50 | = | 16 | 2 | 3 | 3 |

