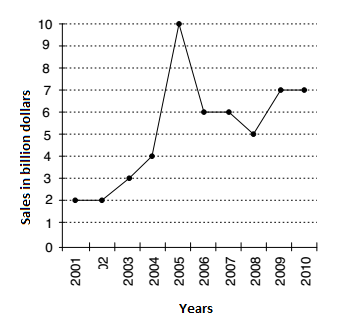
Direction: The following line diagram represents the yearly sales figures of a company in the years 2001–2010.
Examine the diagram and answer the following questions.
-
Average sale (in billion) of the company during the period 2003 – 2007 is :
-
- 5.8
- 5
- 6
- 5.5
Correct Option: A
As per given line graph, we can see that the
Sales in 2003 = 3 billion $
Sales in 2004 = 4 billion $
Sales in 2005 = 10 billion $
Sales in 2006 = 6 billion $
Sales in 2007 = 6 billion $
| Required average sale = |  | sum of all sales of the companies during the period 2003 to 2007 |  | billion $ |
| total numbers of sales of companies |
| Required average sale = | | 3 + 4 + 10 + 6 + 6 | | billion $ |
| 5 |
| Required average sale = | | 29 | | billion $ |
| 5 |
| Required average sale = |  | 29 |  | = 5.8 billion $ |
| 5 |

