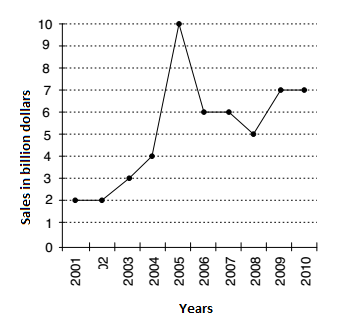
Direction: The following line diagram represents the yearly sales figures of a company in the years 2001–2010.
Examine the diagram and answer the following questions.
-
The ratio of sales in 2002 to that in 2007 is :
-
- 2 : 3
- 1 : 3
- 1 : 1
- 3 : 2
Correct Option: B
As per given graph, we can see that,
Sales in 2002 = 2 billion dollar
Sales in 2007 = 6 billion dollar
∴ Required ratio = sales in 2002 : sales in 2007
Required ratio = 2 : 6 = 1 : 3

