-
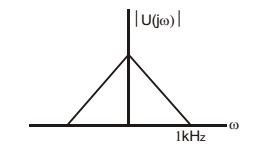
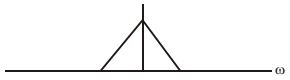
The frequency spectrum of a signal is shown in the figure. If this signal is ideally sampled at intervals of 1 ms, then frequency spectrum of the sampled signal will be
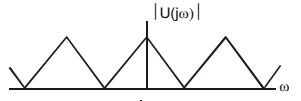
Correct Option: D
Here, frequency of signal, ωc = 1 kHz
| Sampling frequency, ωs = | = 1kHz | |
| 1ms |
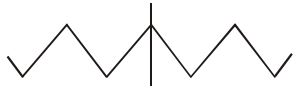
For an ideal sampler, ωs > 2ωc
But here ωs = ωc
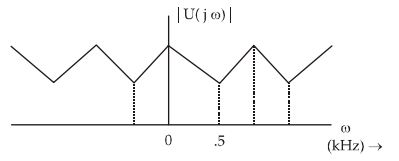
so, at ωs/2, next sampling will start resulting sampled signal will be as follows: