Pie chart
Direction: Study the pie-charts carefully to answer the questions that follow.

- Which college has the maximum number of boys?
-
View Hint View Answer Discuss in Forum
As per first graph,
The number of students in Collage A = Total number of students x 21%
As per second graph,
The number of girls from College A = Total number of girls x 23%
So number of boys in Collage A = The total number of students in Collage A - The total number of girls in Collage A.
Similarly for other collage also apply the same formula.Correct Option: C
As per first graph,
The number of students in Collage A = Total number of students x 21%
As per second graph,
The number of girls from College A = Total number of girls x 23%
So number of boys in Collage A = The total number of students in Collage A - The total number of girls in Collage A.
Number of boys in college A = 3500 x 21/100 - 1800 x 23/100 = 735 - 414 = 321
Similarly we can get the number of boys from other collages.
Number of boys in college B = 3500 x 9/100 - 1800 x 10/100 = 315 - 180 = 135
Number of boys in college C = 3500 x 33/100 - 1800 x 31/100 = 1155 - 558 = 597
Number of boys in college D = 3500 x 18/100 - 1800 x 11/100 = 630 - 198 = 432
Hence, number of boys in college C has maximum.
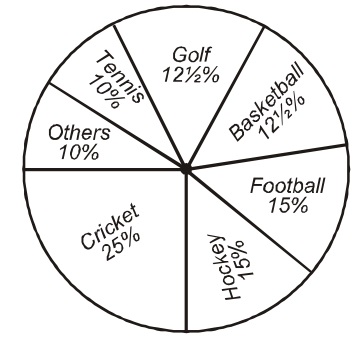
Direction: The pie chart, drawn here, shows the spending of a country on various sports during a particular year. Study the graph carefully and answer the questions that follow:
- Out of the following the country spent the same amount on:
-
View Hint View Answer Discuss in Forum
According to the graph, Hockey and Football are having the same percentage.
Expenditure on the game of Football = 15% of total amount spent
Expenditure on the game of Hockey = 15% of total amount spentCorrect Option: B
According to the graph, equal amount has been spent on Hockey and Football because the same percentage given in graph.
Expenditure on the game of Football = 15% of total amount spent
Expenditure on the game of Hockey = 15% of total amount spent
- Graph shows that the most popular game of the country is:
-
View Hint View Answer Discuss in Forum
According to the graph, expenditure on cricket is the maximum.
Correct Option: C
According to the graph, expenditure on cricket is the maximum. Therefore cricket is the most popular game.
- If the total amount spent on sports during the year was Rs. 1,20,00,000. how much was spent on basketball?
-
View Hint View Answer Discuss in Forum
According to question, Total spent 100% = 1,20,00,000
According to graph,
∴ Expenditure on the game of Basketball = 121/2 %Correct Option: D
According to question, Total spent 100% = 1,20,00,000
According to graph,
∴ Expenditure on the game of Basketball = 121/2 %
∴ The Amount spend on the game of Basketball = 121/2% of 1,20,00,000 = 25 x 1,20,00,000/100 = Rs. 15,00,000
- If the total amount spent on sports during the year was Rs. 30,00,000. The amount spent on cricket and hockey together was:
-
View Hint View Answer Discuss in Forum
According to question the total amount spent = Rs. 30,00,000 = 100%
∴ Expenditure on the games of Cricket and Hockey = 25% + 15% = 40%Correct Option: B
According to question the total amount spent = Rs. 30,00,000 = 100%
∴ Total Expenditure on the games of Cricket and Hockey = 25% + 15% = 40%
∴ The total amount spend on the games of Cricket and Hockey = 40% of 30,00,000 = 40 x 30,00,000/100 = 40 x 30,000 = Rs. 12,00,000

