Pie chart
Direction: The pie-chart provided below gives the distribution of land (in a village) under various food crops. Study the pie-chart carefully and answer the questions.
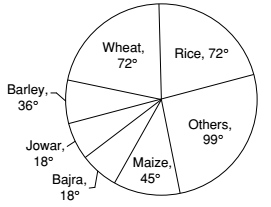
- If 10% of the land reserved for rice be distributed to wheat and barley in the ratio 2 : 1, then the angle corresponding to wheat in the new pie-chart will be:
-
View Hint View Answer Discuss in Forum
∴ New corresponding angle for wheat = Old corresponding angle for wheat + Increase in the corresponding angle of wheat
Correct Option: B
From above given chart ,
Corresponding angle for wheat is represented by 72°
10% of 72° = 7.2°
Ratio of wheat and barley = 2 : 1
∴ Increase in the corresponding angle of wheat= 2 x 7.2 = 4.8° 3
∴ New corresponding angle for wheat = Old corresponding angle for wheat + Increase in the corresponding angle of wheat
= 72° + 4.8° = 76.8°
Direction: The pie-chart drawn below shows the expenses of a family on various items and its savings during the year 2001. Study the graph and answer the questions given below :
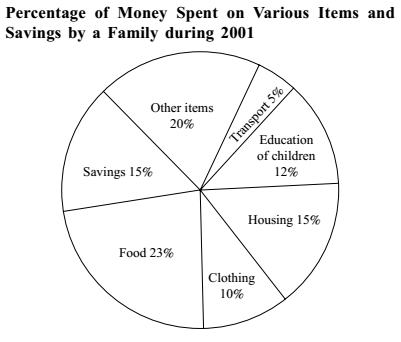
- The total savings of the family for the year were equal to the expenditure on:
-
View Hint View Answer Discuss in Forum
From above given graph ,
∵ Expenditure on housing = Savings = 15%.Correct Option: C
From above given graph ,
The total savings of the family for 2001 year will be equal to the expenditure on housing , which is 15%.
i.e. Expenditure on housing = Savings = 15%.
- If the total income of the family was $ 100000, how much money was spent on the education of children?
-
View Hint View Answer Discuss in Forum
Given:- total income of the family = $ 100000
From above given graph ,
Expenditure on the education of the children = 12%Correct Option: B
Given:- total income of the family = $ 100000
From above given graph ,
Expenditure on the education of the children = 12% of $ 100000Expenditure on the education of the children = 12 x 100000 = $ 12000 100
- Maximum expenditure of the family was on
-
View Hint View Answer Discuss in Forum
From above given graph ,
Maximum expenditure of the family is on food, which is 23%Correct Option: A
From above given graph ,
According to given option in question , Maximum expenditure of the family is on food ,which is 23%.
Direction: The pie-chart provided below gives the distribution of land (in a village) under various food crops. Study the pie-chart carefully and answer the questions.
- If the total area under bajra was 300 acres, then the total area (in hundred acres) under rice and barely together is :
-
View Hint View Answer Discuss in Forum
As per given pie chart , we can see that
Angle for rice = 72°
Angle for barley = 36°
The total angle for rice and barley = 72° + 36° = 108°
Total area of bajra is represented by 18° = 300 acresCorrect Option: A
As per given pie chart , we can see that
Angle for rice = 72°
Angle for barley = 36°
The total angle for rice and barley = 72° + 36° = 108°
Total area of bajra is represented by 18° = 300 acres
∴ The total area in angle of rice and barely = 108°∴ 1 ° = 300 acres 18
∴ The total area in angle of rice and barely = 108°∴ The total area in acres of rice and barely = 300 x 108 = 1800 acres 18

