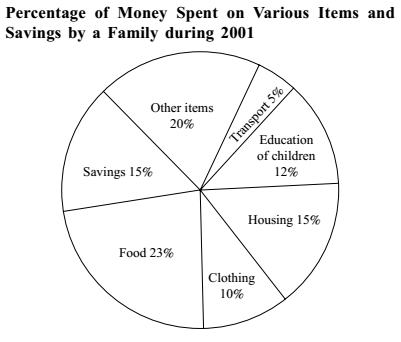
Direction: The pie-chart drawn below shows the expenses of a family on various items and its savings during the year 2001. Study the graph and answer the questions given below :
-
The total savings of the family for the year were equal to the expenditure on:
-
- Food
- Clothing
- Housing
- Other items including transport
Correct Option: C
From above given graph ,
The total savings of the family for 2001 year will be equal to the expenditure on housing , which is 15%.
i.e. Expenditure on housing = Savings = 15%.

