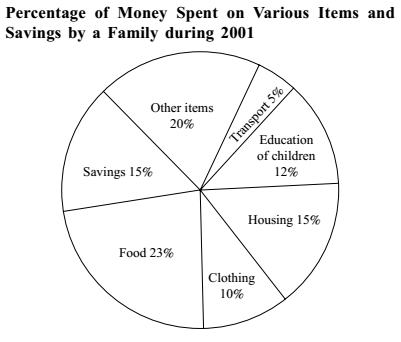
Direction: The pie-chart drawn below shows the expenses of a family on various items and its savings during the year 2001. Study the graph and answer the questions given below :
-
Maximum expenditure of the family was on
-
- Food
- Housing
- Education of Children
- Other items
Correct Option: A
From above given graph ,
According to given option in question , Maximum expenditure of the family is on food ,which is 23%.

