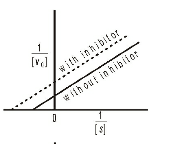
Graph A represent uncompetitive inhibition
Previous Question Next Question
Your comments will be displayed only after manual approval.