-
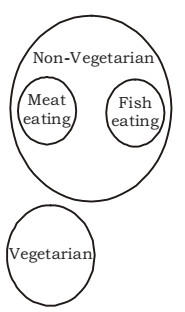
In a feast organised in connection with a marriage, some of the participants were vegetarians, some others were non-vegetarians. Another group was of non-vegetarians not eating meat and yet another group of people eating meat but not fish. Which of the following represents this statistics?
-
- .

- .

- .

- .

- .
Correct Option: B
On the basis of above given question , we can say that
some of the participants were vegetarians, some others were non-vegetarians. Another group was of non - vegetarians not eating meat and yet another group of people eating meat but not fish. It means that vegetarians are different from non - vegetarians .
From above it is clear that option ( B ) will be required answer. As shown in given venn - diagram .