Direction: Study the following graph carefully and answer the questions given below.
-
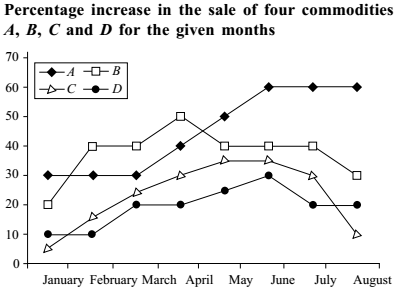
For which months did the sale of commodities A and D show increase?
-
- April only
- May and June only
- May, June and July only
- April, May and June only
- None of these
Correct Option: B
From above given graph we can see that there are two months for which graph is going Up.
By seeing the graph we can see that graph is going up for the month of May and June.
So required answer will be May and June only.

