Home » Data Interpretation » Line chart » Question

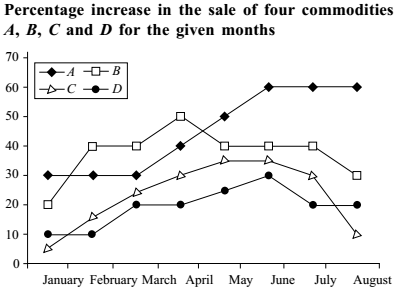
Direction: Study the following graph carefully and answer the questions given below.

  1. If the sale of C was 100 in May, what was its sale in July?
    1. 195
    2. 100
    3. 90
    4. Cannot be determined
    5. None of these
Correct Option: E

From above given graph ,

Sale of commodity C in July = 100 x95= 95.
100


Your comments will be displayed only after manual approval.