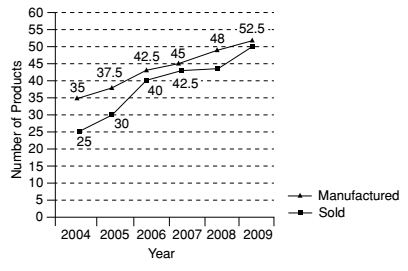
Direction: Study the following graph carefully to answer the questions.
Number (in thousands) of products manufactured and sold by a company over the years.
-
What is the difference between the number of products manufactured by the company in the year 2009 and in 2008?
-
- 4000
- 5500
- 3500
- 4500
- None of these
Correct Option: D
From the given graph, We can see that,
Number of products manufactured in 2009 = (52.5) × 1000
Number of products manufactured in 2008 = (48) × 1000
Required Difference = Number of products manufactured in 2009 - Number of products manufactured in 2008
Required Difference = ( 52.5 − 48 ) × 1000 = 4.5 x 1000 = 4500

