Direction: Study the following graph carefully to answer the questions.
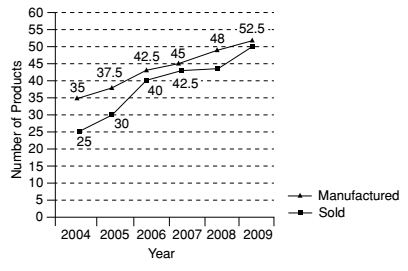
Number (in thousands) of products manufactured and sold by a company over the years.
-
What is the ratio of the number of products not sold by the company in the year 2007 to that not sold in the year 2005?
-
- 3 : 1
- 6 : 5
- 1 : 3
- 5 : 6
- None of these
Correct Option: C
As per given graph ,
Number of products not sold by the company in the year 2007 = Number of products manufactured − Number of products sold = 45 - 42.5 = 2.5 ( in thousands )
Number of products not sold by the company in the year 2005 = Number of products manufactured − Number of products sold = 37.5 - 30 = 7.5 ( in thousands )
∵ ratio = Number of products not sold by the company in the year 2007 : Number of products not sold by the company in the year 2005
= 2.5 : 7.5 = 1 : 3

