Direction: Study the following graph carefully to answer the questions.
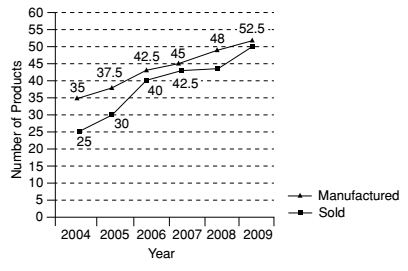
Number (in thousands) of products manufactured and sold by a company over the years.
-
The number of products sold by the company in the year 2004 is what percent of the number of products manufactured by it in that year? (Rounded off to two digits after decimal)
-
- 71.43
- 67.51
- 81.67
- 56.29
- None of these
Correct Option: A
From the given above graph,
The number of products sold by the company In year 2004 = 25
The number of products manufactured by the company In year 2004 = 35
| Required % = | The number of products sold by the company in the year 2004 | x 100 % |
| The number of products manufactured by the company in the year 2004 |
| Required % = | 25 | x 100 = 71.43 % |
| 35 |

