Direction: Study the following graph carefully to answer the questions.
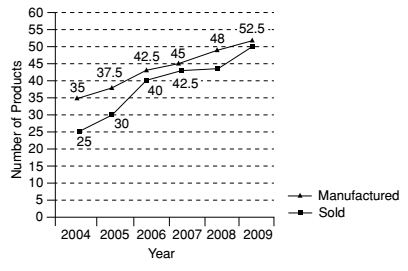
Number (in thousands) of products manufactured and sold by a company over the years.
-
What is the percent increase in the number of products sold by the company in the year 2006 from the previous year? (Rounded off to two digits after decimal)
-
- 19.25
- 33.33
- 10.45
- 42.66
- None of these
Correct Option: B
From above given graph ,
Number of products sold by the company in the year 2006 = 40
Number of products sold by the company in the year 2005 = 30
Total increase in the number of products sold by the company = Number of products sold by the company in the year 2006 - Number of products sold by the company in the year 2005 = 40 - 30 = 10
| Required percent increase = |  | total increase in the number of products sold by the company |  | x 100 % |
| total number of products sold by the company in the year 2005 |
| = | | 10 | | x 100 = 33.33 % |
| 30 |

