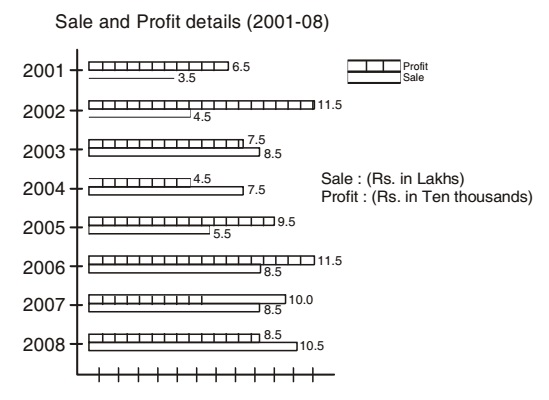
Direction: The bar graph as shows below gives information about the sale and profit details of a departmental store during the years from 2001 - 2008. Study the graph carefully and answer the questions asked here under.
-
Assuming the profit earned during the year 2001 as base (100), the profit made by the store during the year 2008 was:
-
- 76
- 105
- 121
- 131
Correct Option: D
Required profit = 100 x 85 /6.5 = 131

