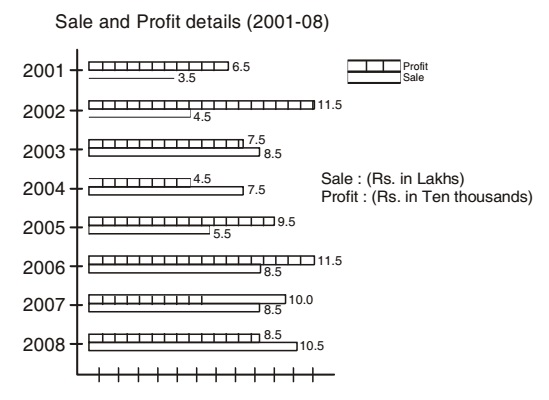
Direction: The bar graph as shows below gives information about the sale and profit details of a departmental store during the years from 2001 - 2008. Study the graph carefully and answer the questions asked here under.
-
During which year between 2001 to 2006 profit made by the store as compared to the previous year was more than 100%?
-
- 2008
- 2007
- 2005
- 2003
Correct Option: C
Profit per cent during the year 2005 as compared to the previous year =(95 - 45) x 100/4.5 = 111.11%
Hence, profit in the year 2005 was more than 100% as compared to the previous year.

