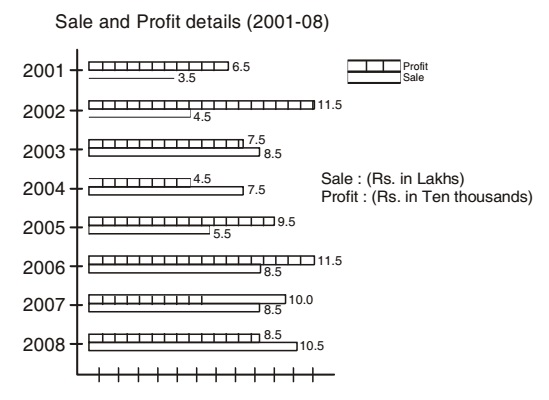
Direction: The bar graph as shows below gives information about the sale and profit details of a departmental store during the years from 2001 - 2008. Study the graph carefully and answer the questions asked here under.
-
During which of the following years percentage of profit earned by the store on the total sale was at the highest level?
-
- 2001
- 2002
- 2003
- 2005
Correct Option: B
Percentage of profit on the total in 2001 = Total profit in rupees x 100/ total sale in rupees.
Percentage of profit on the total in 2001 = 6.5 x 10000 x 100/3.5 x 100000 = 18.57
Percentage of profit on the total in 2002 = 11.5 x 10000 x 100/4.5 x 100000 = 25.56
Percentage of profit on the total in 2003 = 7.5 x 10000 x 100/8.5 x 100000 = 8.82
And Percentage of profit on the total in 2005 = 9.5 x 10000 x 100/ 8.5 x 100000 = 8.82
∴ Percentage of profit on the total sale in 2002 was the highest level.

