Direction: The binding efficiency of three different receptorsR1, R2 and R3 were tested against a ligand using equilibrium dialysis, with a constant concentration of receptor and varying concentrations of ligand. The Scatchard plot of receptor titration with different concentration of ligand is given below (r is moles of bound ligand per moles of receptor and c is concentration of free ligand)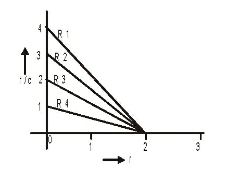
-
The number of ligand binding sites present on receptors R1 and R3, respectively are
-
- 1 and 4
- 1 and 1
- 4 and 1
- 2 and 2
Correct Option: D
From the graph we can see that the value of r is same for all the receptors. ‘r’ is the moles of bound ligand per moles of receptor. So, both R1 and R3 have the same number of sites for ligand binding. Now, in the graph, r = 2. Therefore the number of ligand binding Now, in the graph, r = 2. Therefore the number of ligand binding sites is 2.

