-
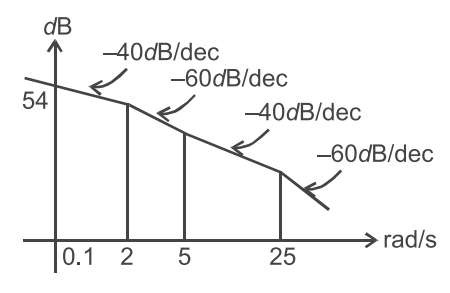
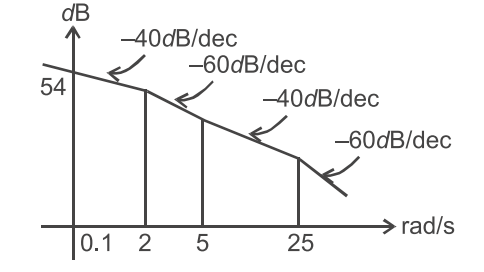
The asymptotic approximation of the log-magnitude versus frequency plot of a minimum phase system with real poles and one zero is shown in figure. Its transfer function is—
-
-
20(s + 5) s(s + 2) (s + 25) -
10(s + 5) (s + 2)2 (s + 25) -
20(s + 5) s2(s + 2) (s + 25) -
50(s + 5) s2(s + 2) (s + 25)
-
Correct Option: D
From figure we conclude at ω = 0·1.
Slope is – 40 dB/dec, it means there are two poles at the origin.
at ω = 2 gain is decay from – 40 dB/dec to – 60 dB/dec it means there is another pole at s = –2 or (s + 2).
and at ω = 5 gain is increases from – 60 dB/dec to – 40 dB/dec, it means there is zero at s = – 5 or (s + 5) and finally another pole at s = –25 or (s + 25). so, the transfer function of the form
| G(s) = | |
| s2(s + 2)(s + 25) |