-
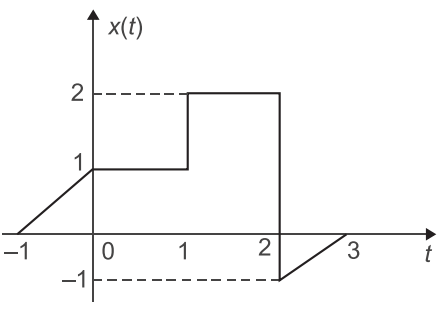
If a plot of a signal x(t) is as shown in the figure—
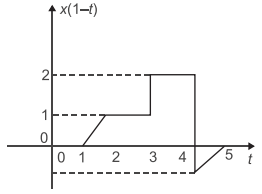
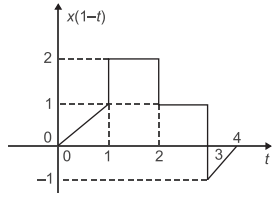
Then the plot of the signal x(1 – t) will be—
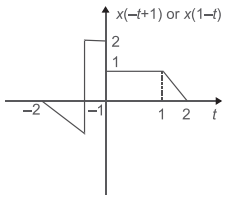
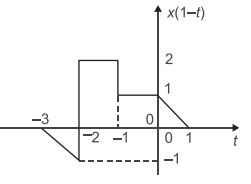
Correct Option: A
The given figure is 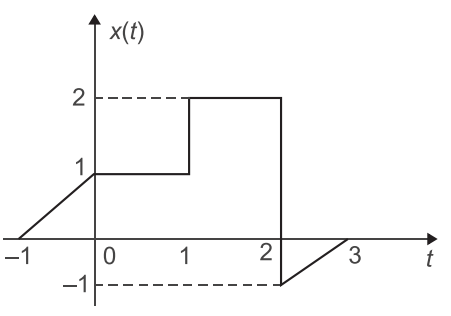
In order to draw the plot x(1 – t) from the given graph x(t). First apply the shifting operation then reflection, if x(t) is shifted to the left by 1, we get 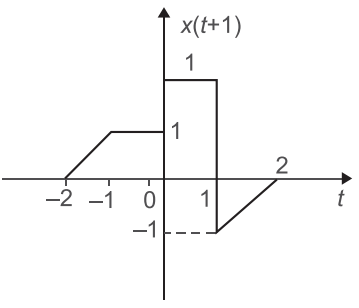
Now apply the time reflection property to get
x(– t + 1) or x(1 – t)
Hence, alternative (A) is the correct choice.

