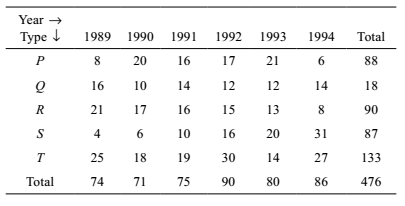
Direction: The Table given below shows production of five types of cars by a company in the years 1989 to 1994. Study the Table and answer questions.
Production of cars by a company
-
During the period 1989–94, in which type of cars was a continuous increase in production?
-
- P
- Q
- R
- S
Correct Option: D
From the values given in above table , it is clear that during the period 1989–94 , the production of S’s car is continuous increase . Hence answer will be S type of cars .

