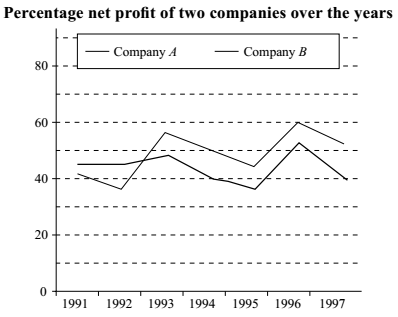
Direction: Study the following graph carefully and answer the questions given below.
-
In which of the following years was the total income more than double the total expenditure in that year for Company B?
-
- 1995
- 1993
- 1997
- 1992
- None of these
Correct Option: E
Income > 2 times of Expenditure
This is only possible when profit is more than 100%.
⇒ Profit % is more than 100, which is not correct for any of the given years.

