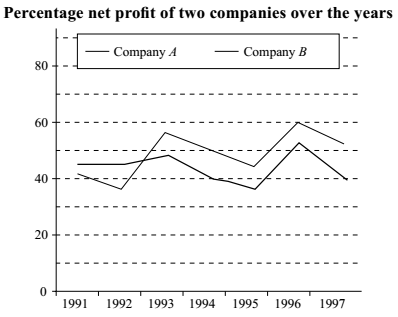
Direction: Study the following graph carefully and answer the questions given below.
-
In how many of the given years the percentage of expenditure to the income of Company A was less than 50% ?
-
- One
- Two
- Three
- Four
- None of these
Correct Option: E
Let us assume that the Expenditure E, Income I and Profit P of company A.
According to formula
| E = I |  | 100 |  |
| 100 + P |
| or, | E | = | |
| I | 100 + P |
According to question
| We require | E | ≤ 50 % or, ≤ | ||
| I | 2 |
| Now We can see that from above both given equation, | ≤ | ||
| 2 |
So, the value of P should be more than 100, which is not correct for any of the given years.

