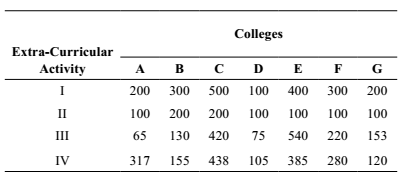
Direction: The following table shows the number of students of 7 colleges A, B, C, D, E, F, G participating in extra-curricular activities :
-
The median of data pertaining to activity III is:
-
- 540
- 229
- 153
- 75
Correct Option: C
Arranging the observations of activity III in ascending order:
65, 75, 130, 153, 220, 420, 540
Number of observations ( n )= 7(odd)
| Required Median = |  | n + 1 |  | th observation |
| 2 |
| ∴ Median = | | 7 + 1 | | th observation |
| 2 |
= fourth observation = 153

