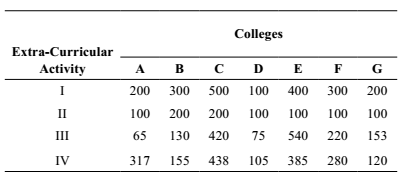
Direction: The following table shows the number of students of 7 colleges A, B, C, D, E, F, G participating in extra-curricular activities :
-
The difference of the range of number of students in activity IV and the average is of number of students in activity III per college is :
-
- 111
- 153
- 104
- 217
Correct Option: C
As per given table , we can see that the
Number of students in all given seven colleges
A = 65 , B = 130 , C = 420 , D = 75 , E = 540 , F = 220 , G = 153
Total numbers of colleges = 7
Number of students in activity IV in college C = 438
Number of students in activity IV in college D = 105
Range of number of students in activity IV = Number of Highest Students in activity IV - Number of lowest Students in activity IV
Range of number of students in activity IV = 438 − 105 = 333
| Average number of students in activity III = | sum of number of students in all seven colleges |
| total numbers of colleges | |
| ∴ Average number of students in activity III = | 65 + 130 + 420 + 75 + 540 + 220 + 153 |
| 7 | |
| ∴ Average number of students in activity III = | 1603 | = 229 |
| 7 | ||
∴ Difference = Range of number of students in activity IV - Average number of students in activity III
∴ Difference = 333 − 229 = 104

