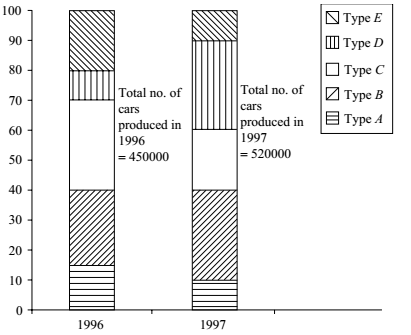
Direction: Study the following graph carefully and then answer the questions based on it. The percentage of five different types of cars produced by a company during two years is given below.
-
If the percentage production of B type cars in 1997 was the same as that of 1996, what would have been the number of cars produced in 1997?
-
- 112500
- 120000
- 130000
- Data inadequate
- None of these
Correct Option: C
Percentage production of B type cars in 1997 = that in 1996 (given)
= (40 − 15) 25% of 520000 = 130000.

