Direction: Study the following table carefully and answer the questions given below.
-
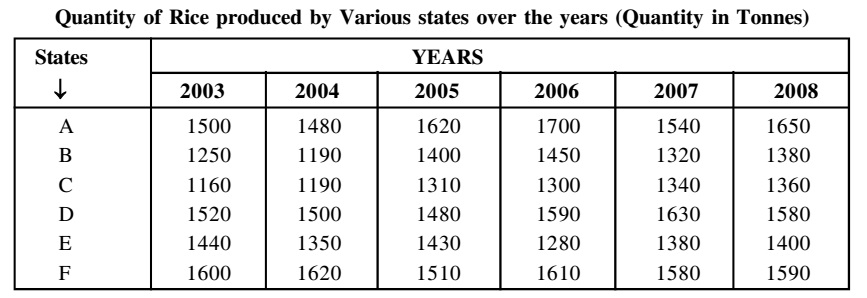
Rice produced by state C in the year 2006 is approximately what percent of rice produced by state A in the same year?
-
- 69
- 72
- 76
- 82
Correct Option: C
As per given Table graph,
Rice produced by state C in years 2006 = 1300
Rice produced by state A in years 2006 = 1700
Required percentage = 1300 x 100 /1700 = 76.47% ≈ 76%

