Home » Soil Mechanics » Soil mechanics miscellaneous » Question
  1. The e-lop p curve shown in the figure is representative of
    1. Normally consolidated clay
    2. Over consolidated clay
    3. Under consolidated clay
    4. Normally consolidated clayey sand
Correct Option: B

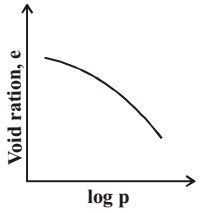
In this e– log P graph, as p increase e, decreases.
∴ It is graph of over consolidated clay.


Your comments will be displayed only after manual approval.