-
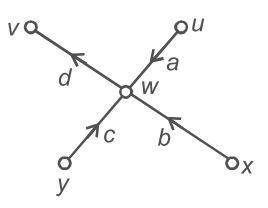
In the signal flow graph shown in the figure, the correct relationship between the various variables is—
-
- w = au + bx + cy – du
- w = au + bx + cy
- w = au + cy + bx
- w = au + cy + bx – dw
- w = au + bx + cy – du
Correct Option: B
Since w is a mixed mode, this is due to the fact that branches leaving a mode does not affect the value of variable represented by that mode so,
w = au + bx + cy