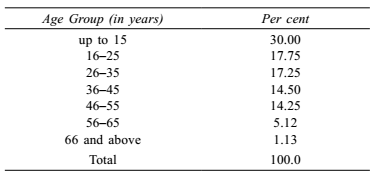
Direction: A Table showing the percentages of the total population of a State by age groups for the year 1991 is given below. Answer the questions given below it.
-
There are 200 million people below 36 years. How many million (approx) people are in the age group 56–65?
-
- 30.07
- 15.75
- 12.72
- 59.30
Correct Option: B
Given :- percentage of people in the age group 56−65 = 5.12
Total number of people age below 36 years = 200 million
∵ Number of people in the age group 56−65
| = | Total number of people age below 36 years | x percentage of people in the age group 56-65 |
| 65 | ||
| = | 200 | x 5.12 ≈ 15.75 |
| 65 | ||

