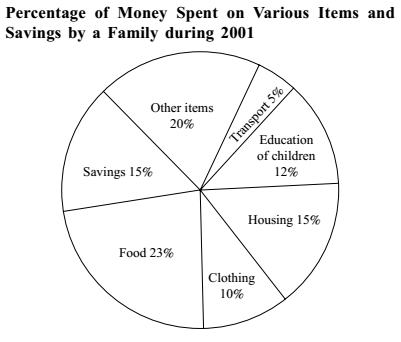
Direction: The pie-chart drawn below shows the expenses of a family on various items and its savings during the year 2001. Study the graph and answer the questions given below :
-
What percent of the income was spent on transport and other items together?
-
- 25 %
- 20 %
- 30 %
- 32 %
Correct Option: A
From above given graph ,
Expenditure on transport and other items = (20 + 5) % = 25%.
total income = 100%
| Required % = | Expenditure on transport and other items | x 100% |
| total income | ||
| = | 25 | x 100% = 25% |
| 100 | ||

