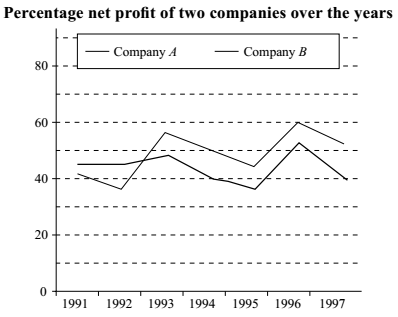
Direction: Study the following graph carefully and answer the questions given below.
-
If the total expenditure of Company B in 1994 was $ 200 , what was the total income?
-
- $ 160 million
- $ 240 million
- $ 260 million
- Data inadequate
- None of these
Correct Option: B
Let us assume that the Expenditure E , income I and profit P %.
As per given graph,
Profit = 40 %
As per given question,
Expenditure = $ 200 Million
| Total income ( I ) = E |  | 100 + % Profit |  |
| 100 |
| Total income ( I ) = 200 |  | 100 + 40 |  | million $ = 280 million $ |
| 100 |

