Direction: Study the following graph to answer the given questions.
-
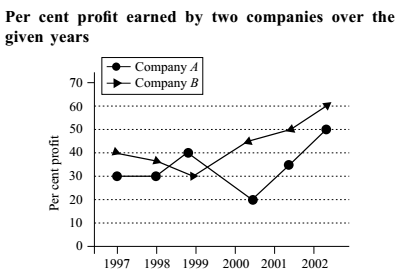
If the expenditure of Company B in 2000 was $ 200 billion, what was its income?
-
- $ 240 billion
- $ 220 billion
- $ 160 billion
- Cannot be determined
- None of these
Correct Option: A
As per given line graph,
Percentage Profit in 2000 by Company B = 20 %
As per given question,
Expenditure of Company B in 2000 = 200 billion $
Use the below formula to calculate the Income of company in 2000
| Income of Company B in 2000 = Expenditure of Company B in 2000 x | 100 + % Profit | |
| 100 |
| Income of Company B in 2000 = 200 x | 120 | = $ 240 billion |
| 100 |

