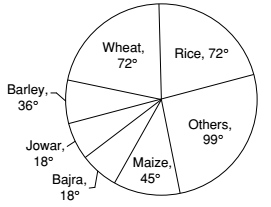
Direction: The pie-chart provided below gives the distribution of land (in a village) under various food crops. Study the pie-chart carefully and answer the questions.
-
The combination of three crops which contribute to more than 50% of the total area under the food crops is:
-
- Wheat, rice and maize
- Wheat, rice and jowar
- Wheat, rice and bajra
- Rice, barley and maize
Correct Option: A
From above given chart ,
∴ 100% = 360°
∴ 50% = 180°
∴ wheat + rice + maize = 72° + 72° + 45° = 189° > 180°
Hence the total area of wheat , rice and maize food crops is more than 50% of the total area of given food crops .

