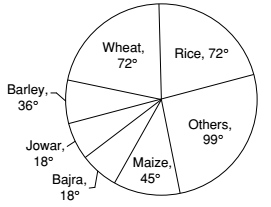
Direction: The pie-chart provided below gives the distribution of land (in a village) under various food crops. Study the pie-chart carefully and answer the questions.
-
The ratio of the land used for rice and barley is :
-
- 3 : 1
- 1 : 2
- 2 : 1
- 3 : 2
Correct Option: C
As per given pie-chart , we can see that
The land used for rice is represented by 72°
The land used for barley is represented by 36°
∴ Required ratio = rice crops : barley crops
Required ratio = 72° : 36° = 2 : 1

