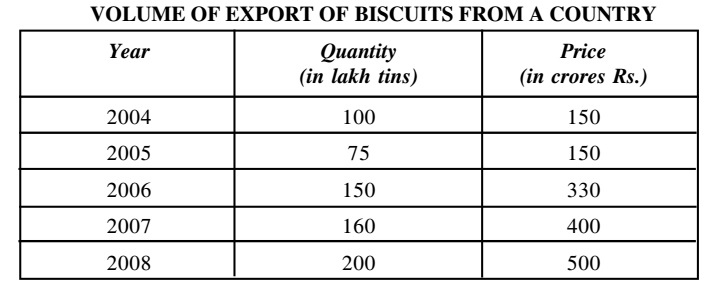
Direction: Figures of biscuit exports from a country during various years are given in the following table. Study the table carefully and answer the questions that follows:
-
During which years price per tin remained at the same level?
-
- 2006 and 2008
- 2006 and 2007
- 2007 and 2008
- 2006 and 2004
Correct Option: C
Export price per tin in 2004 = Price in 2004/ Quantity in 2004
Export price per tin in 2004 = 150 crores/ 100 lakhs = Rs. 150
Export price per tin in 2005 = Price in 2005 / Quantity in 2005
Export price per tin in 2005 = Rs. 150 crores/Rs. 75 lakhs = Rs. 200
Export price per tin in 2006 = Price in 2006 / Quantity in 2006
Export price per tin in 2006 = Rs. 330 crores/Rs. 150 lakhs = Rs. 220
Export price per tin in 2007 = Price in 2007/ Quantity in 2007
Export price per tin in 2007 = Rs. 400 crores/Rs. 160 lakhs = Rs. 250
Export price per tin in 2008 = Price in 2008/ Quantity in 2008
Export price per tin in 2008 = Rs. 500 crores/Rs. 200 lakhs = Rs. 250
it is clear that per tin export price was same in 2007 and 2008.

