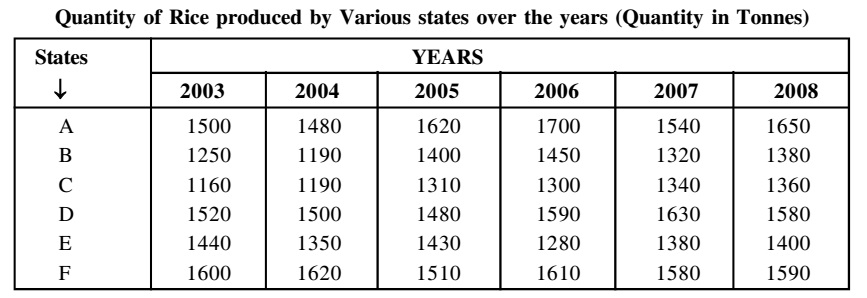
Direction: Study the following table carefully and answer the questions given below.
-
In which year was the production of rice the highest in all the states together?
-
- 2005
- 2006
- 2007
- 2008
Correct Option: D
Production of rice in different years by all states together:
2000 → 1500 + 1250 + 1160 + 1520 + 1440 + 1600 = 8470 tonnes
2004 → 1480 + 1190 + 1190 + 1500 + 1350 + 1620 = 8330 tonnes
2005 → 1620 + 1400 + 1310 + 1480 + 1430 + 1510 = 8750 tonnes
2006 → 1700 + 1450 + 1300 + 1590 + 1280 + 1610 = 8930 tonnes
2007 → 1540 + 1320 + 1340 + 1630 + 1380 + 1580 = 8790 tonnes
2008 → 1650 + 1380 + 1360 + 1580 + 1400 + 1590 = 8960 tonnes
Hence, in year 2008 the production of rice was the highest.

