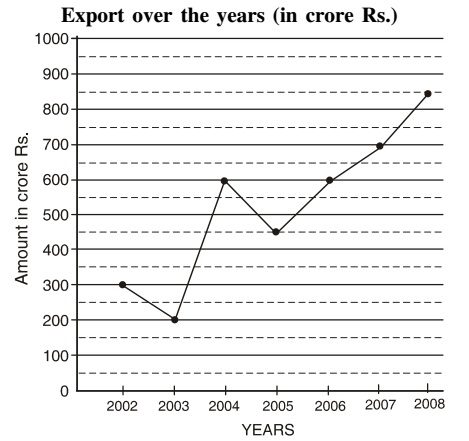
Direction: Study the following graph to answer the given questions.
-
Which year has the highest percent increase/decrease in exports as compared to the previous year?
-
- 2004
- 2005
- 2007
- 2008
Correct Option: B
As we see in the graph the Export graph is higher for 2003 to 2004 years. So we will calculate for this year.
Required percentage for 2004 = (Export in 2004 - Export in 2003) x 100/Export in 2004
Required percentage for 2004 = (600 - 200) x 100/200 = 200%

