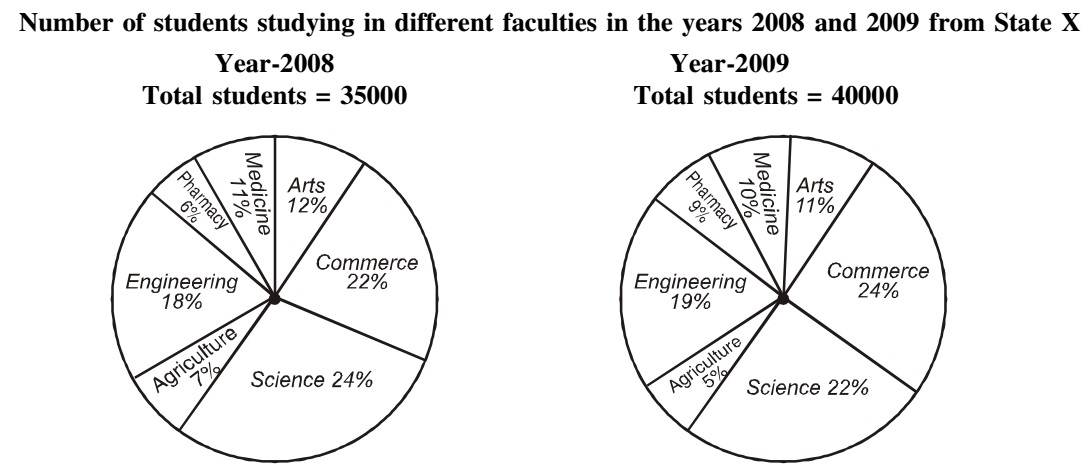
Direction: Study the following pie-diagrams carefully to answer these questions
-
In which faculty there was decrease in the number of students from 2008 to 2009?
-
- Arts
- Agriculture
- Pharmacy
- None of these
Correct Option: B
In 2008, number of students in Arts = Total Student x 12%
In 2008, number of students in Arts = 35000x12 /100 = 4200
In 2009, number of students in Arts = Total Student x 11%
In 2009, number of students in Arts = 40000x11/100 = 4400
In 2008, number of students in Agriculture = Total Student x 7%
In 2008, number of students in Agriculture = 35000 x 7/100 = 2450
In 2009, number of students in Agriculture = Total Student x 5%
In 2009, number of students in Agriculture = 40000x5/100 = 2000
In 2008, number of students in Pharmacy = Total Student x 6%
In 2008, number of students in Pharmacy = 35000 x 6/100 = 2100
In 2009, number of students in Pharmacy = Total Student x 9%
In 2009, number of students in pharmacy = 9/100 x 40000 = 3600
Hence, in Agriculture there was decrease in the number of students from 2008 to 2009.

