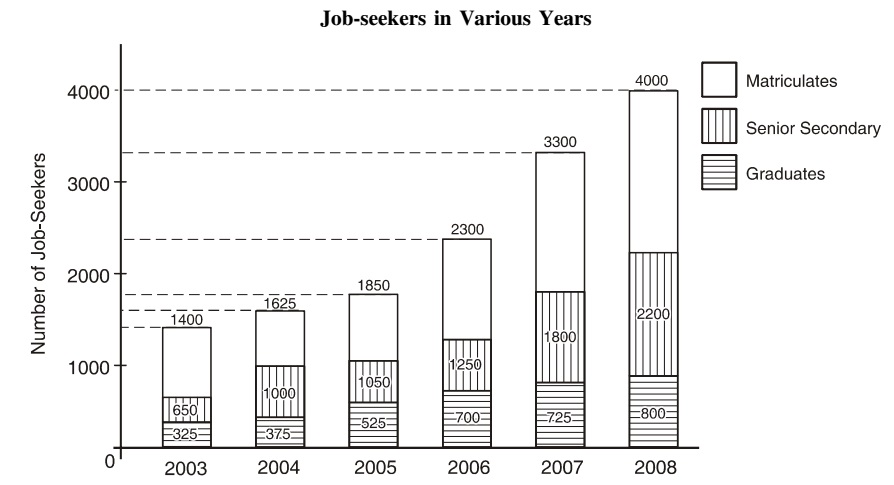
Direction: The bar graph given here shows the number of job-seekers of a state in various years at different stages of education.
-
In comparison to the year 2003, how many job-seekers in all, were there in the year 2008?
-
- 1700
- 2075
- 2275
- 2375
Correct Option: D
In 2004. total number of job seekers = 1625
In 2008. total number of job seekers = 4000
Required difference = 4000 - 1625 = 2375

