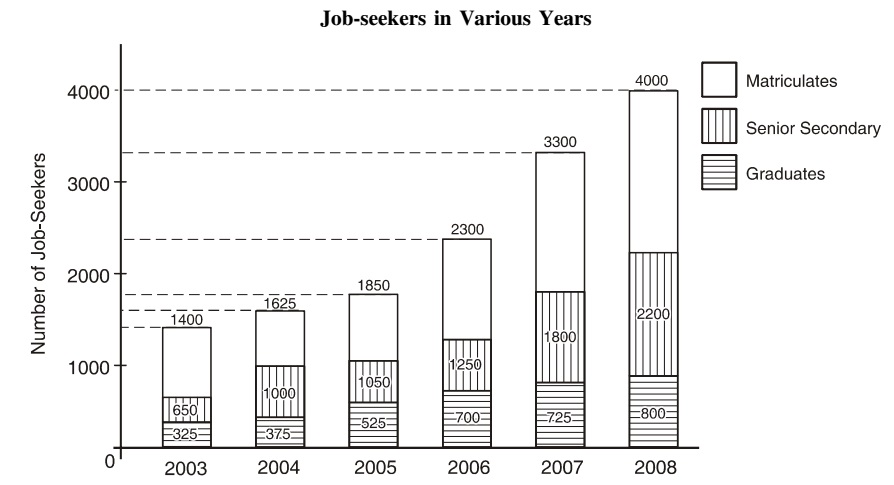
Direction: The bar graph given here shows the number of job-seekers of a state in various years at different stages of education.
-
In which year was the number of Graduate job-seekers the same as that of Senior Secondary job-seekers?
-
- 2004
- 2005
- 2006
- 2007
Correct Option: B
In 2004. number of Graduate job-seekers = 375
In 2004. number of Senior Secondary job-seekers = 1000 - 375 = 635
In 2005. number of Graduate job-seekers = 525
In 2005. number of -seekers Senior Secondary job-seekers = 1050 - 525 = 525
Hence, in, 2005, number of Graduate job-seekers was the same as that of Senior Secondary job-seekers.

