Direction: Study the following Graph carefully and answer the questions given below.
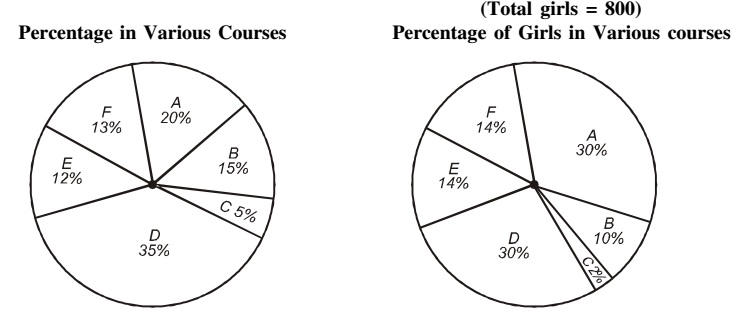
Percentage of students in various courses (A, B, C, D, E, F) and Percentage of girls out of these.
Total students = 1200 (800 girls + 400 boys)
-
For which course is the number of boys the minimum?
-
- A
- C
- E
- F
Correct Option: A
As per first graph,
The number of students for course A = Total number of students x 20%
As per second graph,
The number of girls for course A = Total number of girls x 30%
Number of boys in course 'A' = The number of students for course A - The number of girls for course A
Number of boys in course 'A' = (1200 x 20/100 ) - ( 800 x 30/100 ) = 240 - 240 = 0
Number of boys in course 'C' = (1200 x 5/100 ) - (800 x 2/100) = 60 - 16 = 44
Number of boys in course 'E' = (1200 x 12/100 ) - 800 x 14/100 ) = 144 - 112 = 32
Number of boys in course 'F' = (1200 x 13/100 ) - ( 800 x 14/100 ) = 156 - 112 = 44
Hence, in course 'A' number of boys is minimum which is Zero.

