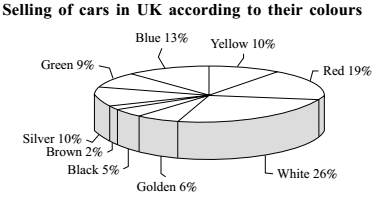
Direction: Study the chart and give the answers of following questions.
-
If in a certain period the total production of all cars was 95400 then how many more blue cars were sold than green?
-
- 2580
- 3618
- 2850
- 3816
- None of these
Correct Option: D
From above given chart ,we have
total production of all cars = 95400
| No. of blue cars sold = | 13 | x 95400 = 12402 | 100 |
| No. of Green cars sold = | 9 | x 95400 = 8586 | 100 |
Required answer = No. of blue cars sold - No. of Green cars sold
= 12402 - 8586 = 3816

