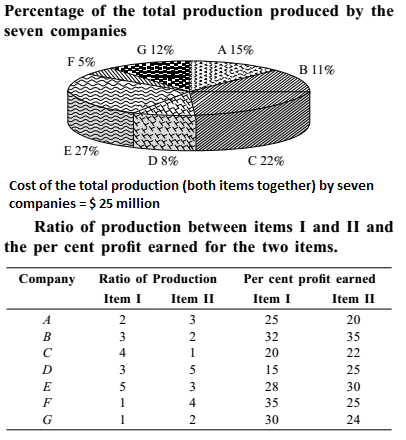
Direction: Seven companies A, B, C, D, E, F and G are engaged in production of 2 items I and II. The comparative data about production of these items by the 7 companies is given in the following graph and Table. Study them carefully and answer the questions given below.
-
What is total profit earned by company G for items I and II together?
-
- $ 78 million
- $ 1.62 million
- $ 7.8 million
- $ 16.2 million
- None of these
Correct Option: A
From above given table , we have
Given :- cost of the total production by companies = $ 25
For G company for items I ,
Ratio of total production = 3 , Ratio of total production of item I = 1
% of total production produced by G = 12%
% of profit earned by company G for items I = 30%
For G company for items II ,
Ratio of total production = 3 , Ratio of total production of item II = 2
% of profit earned by company G for items II = 24%
total profit earned by company G for items I and II together
| = | 1 | x | 12 | x | 25 | x | 30 | + | 2 | x | 12 | x | 25 | x | 24 |
| 3 | 100 | 100 | 3 | 100 | 100 |
= 0.3 + 0.48 + = $ 78 million

